
When measuring product-market fit, you should consider the following:
- Your customers’ satisfaction level
- Engagement level with your products/services
- Frequency of your customers’ use of your product/services
- The number of users/customers you get through word of mouth.
Depending on the type of business model and industry, the metrics may be different. For instance, an ecommerce business may be more interested in customer satisfaction, while a mobile app might pay more attention to the product usage interval, etc.
But at the same time, despite the differences, it’s important to remember one common truth: Product-market fit is all about the actual value your users/customers get from your product/service.
Below we’ll discuss the essential product-market fit metrics you should consider during the validation of your product/service.
Essential Product-Market Fit Metrics
Net Promoter Score (NPS)
You might have heard that many companies often send an NPS survey to their customers to measure the product-market fit.
But what is NPS?
Well, NPS stands for Net Promoter Score.
It’s a metric that measures how satisfied your customers are with your product/service. Also, it can help you understand where there might be gaps in the user experience for them and give valuable feedback on certain aspects of your product/service.
This metric is widely used by all kinds of businesses, whether ecommerce, services, or SaaS.
Measuring the Net Promoter Score is pretty easy: You just need to ask your customers one simple question:
How likely are you to recommend [product] to a friend or colleague?
In answering your question, the customers have to rate from 1–10.
The answer will help you determine two things:
- Your current customers’ happiness level with your products and services, and
- How likely is it that they would do word-of-mouth advertising for you?
You can imagine that having an answer to this question should be critical.
But it’s not enough. Although quite important, NPS cannot work as a standalone metric.
A simple Net Promoter Score (NPS) Survey alone cannot tell you for sure if you’ve found a product-market fit or not. It won’t give you an idea on how your users feel about your product or service either.
That’s exactly why you should be using NPS along with other metrics.
NPS – A complementary question
To make your NPS stronger, you can apply a complementary question. This is done by gauging what percentage of your customers would be distraught if they couldn’t purchase from you anymore. As a result, you learn the true worth of your product.
This additional question usually looks like this:
How would you feel if you could no longer use [product]?
The answers are the following:
- Very disappointed
- Somewhat disappointed
- Not disappointed (it isn’t really that useful)
- N/A — I no longer use [product]
Now stop here and think of one product that you know you can’t live without. What would happen if you could no longer use this product?
If the answer to that question is “Very disappointed,” then the creators have done a great job with your favorite thing!
Your customers should be thinking along those same lines for your products and services too. Indeed, if you find that over 40% of your users are saying that they would be “very disappointed” without your product, then you know your product is indeed a “must-have,.”
There’s a great chance to build sustainable, scalable customer acquisition growth. This approach is also called the Sean Ellis testing method, suggested the co-author of “Hacking Growth,” Sean Ellis.
CSAT (Customer Satisfaction)
Now let’s get to the third metric, which allows you to gauge your customers’ satisfaction level.
The question that you have to ask is the following:
How would you rate your overall satisfaction with the [product/service] you received?
And here are the answers:
- Very Unsatisfied
- Unsatisfied
- Neutral
- Satisfied
- Very Satisfied
In fact, this CSAT, combined with NPS, can give you a really good idea of how your customers feel about your product or service.
🗣 Numbers don’t tell the full story—real conversations do.
While NPS gives you a score, it doesn’t reveal why customers feel the way they do. With Prelaunch’s In-Depth Interviews, you can go beyond the numbers, directly speak to potential buyers, and uncover the real reasons behind their decisions.
Retention Cohort
Another important metric to measure product-market fit is the retention cohort or curve.
According to Amplitude, the retention curve is “…a line graph depicting the average percentage of active users for each day within a specified timeframe.”
In other words, retention cohorts show whether new users are coming back week over week. If this does happen, then it’s a good indicator that they’re getting value out of your product, and the probability of their using it in future weeks is pretty high.
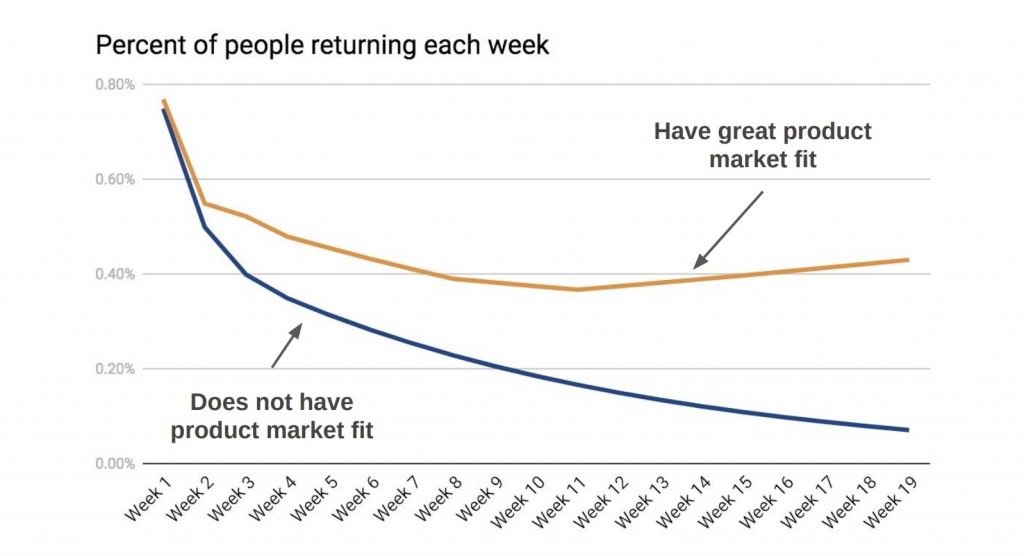
The graph shows the percentage of users that got engaged with content in some way (for instance, commented on a post or watched a video). The tracking of users starts from their signup week (week one) and continues every other week.
If you notice that users stick around for several weeks, then this is a good sign of product-market fit. In case of the absence of product-market fit, the percentage of people returning will come close to zero.
However, there is no one benchmark for you to decide the acceptable percentage of active users indicating product-market fit: It largely depends on a number of factors, including your business model, product, industry, etc.
So the best way to get a realistic perception of the product-market fit of your product is to ask the question the following way: “What is an acceptable percentage of active users for each day for my business?”
Churn Rate
Churn rate, also known as the rate of attrition or customer churn is another measurement of product-market fit.
According to Investopedia, it “is the rate at which customers stop doing business with an entity.” In other words, it shows how many of your customers leave and how soon.
In case of subscription-based businesses, the churn rate measures how many subscribers the company lost for a given period of time.
To grow, a company must make sure the number of its new subscriptions is higher than people who unsubscribe in a given period.
In this sense, the churn rate is diametrically opposite to growth rate—another metric we address below: the first one measures the loss of customers, while the second one—how many customers the company acquired.
Understanding your industry churn rate is important to compare your company with others. Notice that each industry will have a different average churn rate: so find yours to be able to determine your position among your competitors.
Growth Rate
As we mentioned above, the growth rate is the rate at which you acquire customers.
You may think there is one acceptable or reasonable growth rate you should always strive for.
But there’s not.
As with many of the metrics discussed here, everything depends on your business model and industry.
However, most founders agree that the growth rate is an indicator of finding a product-market fit.
Lifetime Value
Life Time Value or LTV is a metric that measures the average revenue your customers will spend over their lifetime with your company.
This actual ‘worth’ of customers can help you in making many economic decisions, ranging from the marketing budget and resources down the line to profitability forecasting.
To increase the LTV of your new customers, you should do your best to reduce churn. To achieve this, you can opt for using a retention strategy tailored toward different LTV segments.
As for companies with non-subscription-based pricing, they can effectively increase LTV by creating and offering add-ons that can be up-sold to their customers.
Overall, by increasing the LTV, you can achieve the following goals:
- Increase the actual value you deliver with your product
- Get more loyal customers who have no reason to look for alternatives to your product
- Result in the long-term profitability of your company
- Improve your product-market fit even further
Thus don’t underestimate this metric that helps you better understand what your customers think about you and make respective decisions based on it.
Product Usage Interval
How often would you like your customers to use your product?
Every week, every day, every month?
If you’re wondering about these questions in terms of finding your product-market fit, then the product usage interval is the metric you’re looking for.
It shows the frequency with which you expect your customers to use your product.
You can choose any frequency you want, depending on your product or service.
For instance, you can break down the usage interval into weeks for ease of measuring the results:
- Day 1 – 7
- Day 8 – 14
- Day 15 -21
Your results may look the following way:
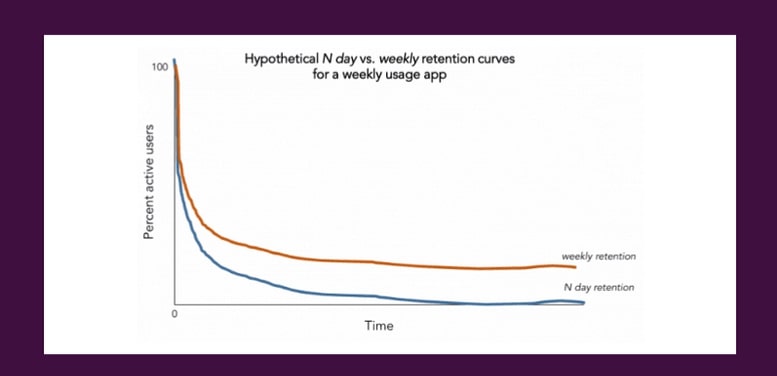
Source: Growth Sandwich
As you can see, there’s steady weekly retention, which is a good sign for product-market fit.
Thus, next time you measure your product-market fit, don’t forget to consider this significant metric.
Now you know everything about methods to measure product-market fit.
The next question is, “Where should I start?”
Well, there are basically two options.
You can start by doing everything on your own, manually, and in steps. But before you get your hands on this huge amount of work and spend most of your investors’ money, think about these statistics: 9 out of 10 startups fail because they build something nobody actually wants.
So to stay on the safe side and make the most out of your product validation process, you can go for an easier, more reliable, and more convenient option by using Prelaunch. This ultimate product validation testing tool serves as an all-in-one platform for testing if there is a demand for your product and at what price, as well as finding out which positioning and design work best for your product.
It provides you everything you need for the prior product validation process in one place: a special landing page for different testings, as well as solid analytics to help you figure out if your product will be the next hit among your backers. Whether you are a startupper or a serial entrepreneur, this tool can help you set the ground for your big success.
Product-market Fit Example
Now let’s consider an example of a successful product-market fit.
We made the tests on Cheerble Fountain S – a smart self-cleaning fountain for pets.
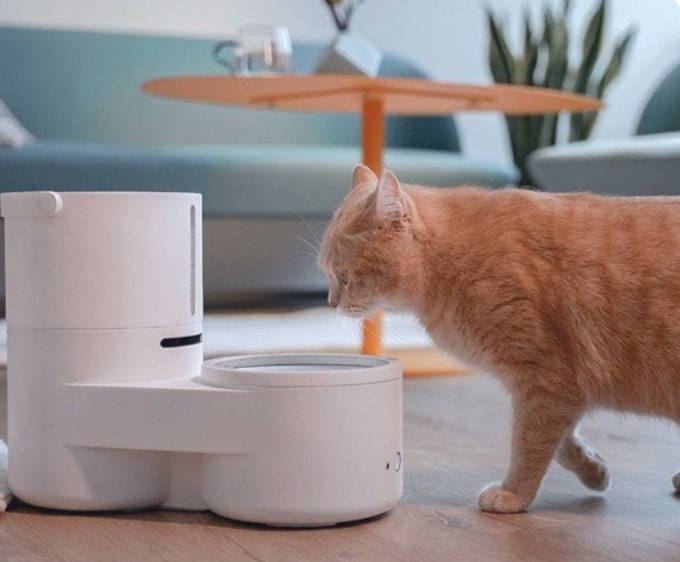
Let’s go through all the steps and find out how we achieved product-market fit.
Positioning
The very first thing we did after taking this product was to find its best positioning. Which of its features should we promote as the key one? Who is our target audience?
Read on to find out how we used the unique selling proposition, target audience, and our customer’s biggest objection to come up with a winning positioning.
Unique Selling Proposition
Any product’s positioning should first and foremost include its unique selling proposition, the one feature that differentiates it from competitor products.
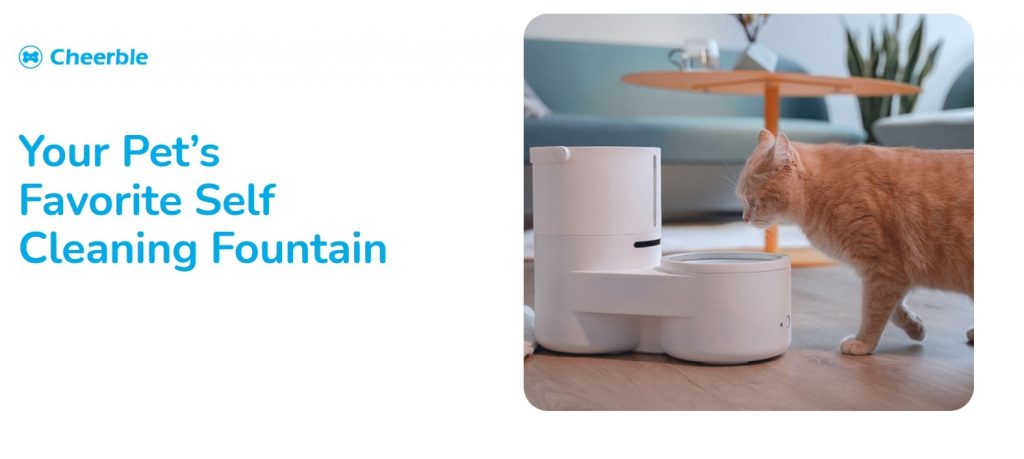
For the Cheerble Fountain S, that feature was apparently the self-cleaning function. The market is full of pet fountains supplying water to pets, but none of them cleans your pet’s dish for you while you’re away.
Thus we came up with a new category – a self-cleaning fountain. This is a new category among other fountains, which simply supply water to a pet and can thus have a wow effect on the audience.
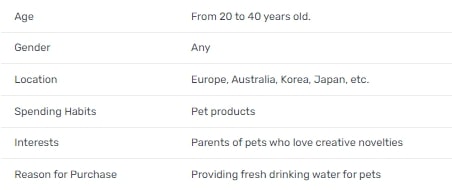
Target Audience
Another issue we faced during positioning was whether we should target cat or dog parents or both.
For this, we sent a survey to our subscribers to see who they needed the Cheerble Fountain S for:

The results showed that 81% of our subscribers needed the fountain for their cats.
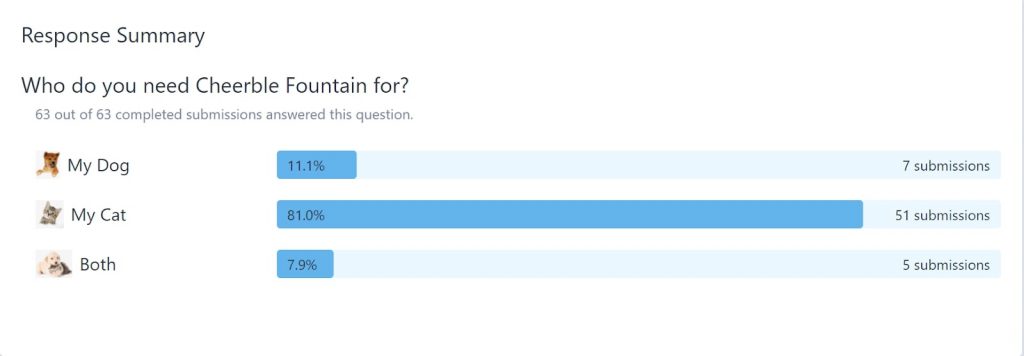
Thus, based on the results of the survey and not to ignore dog parents we decided to still target both pet parents, with a heavy focus on cats through images and gifs on the landing page.
Biggest Objection
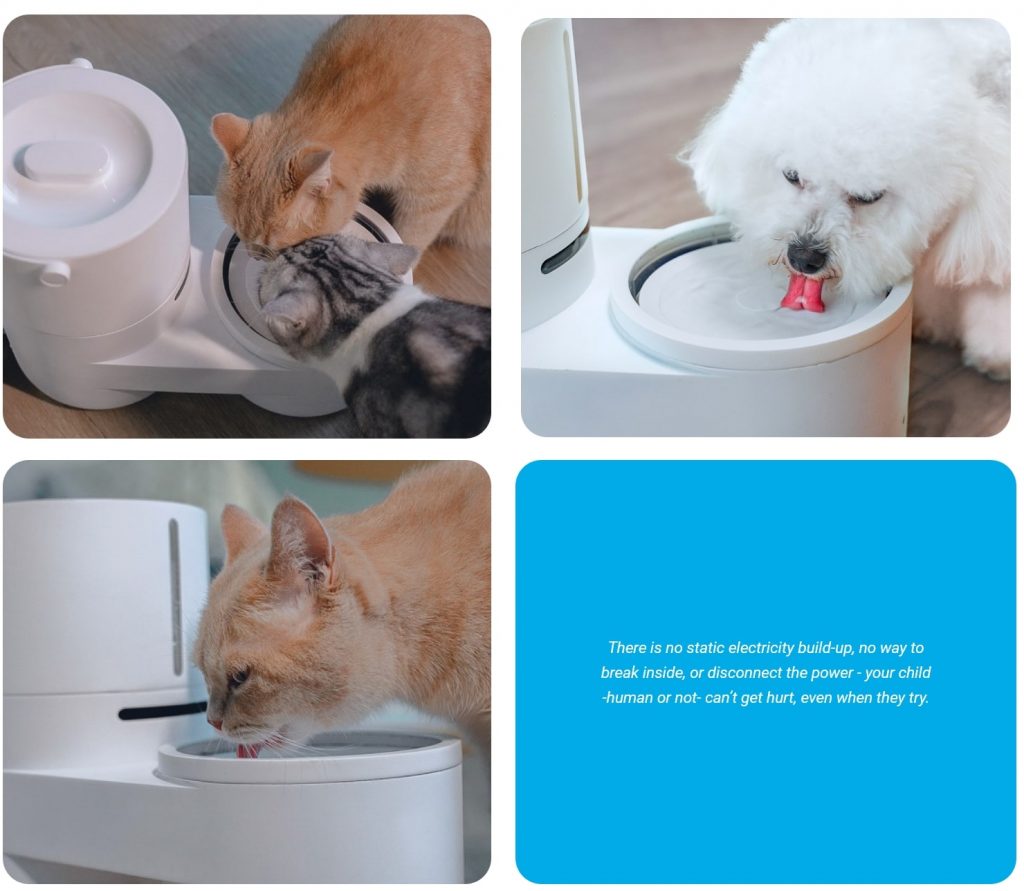
Besides determining the USP and the target audience, we also considered the biggest objection our customers could have. The survey showed that they were afraid their pet wouldn’t love the fountain. Thus, we took that objection and positioned the product as “Your pet’s favorite.” The implication is that the customer’s pet will love it.
After long discussions, here’s the positioning we stick to:
Pretty convincing and to the point, isn’t it? And most importantly, this positioning is based on data from people interested in the product!
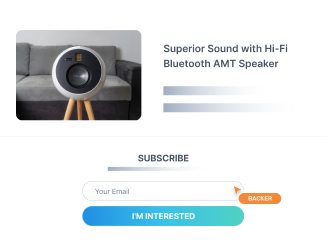
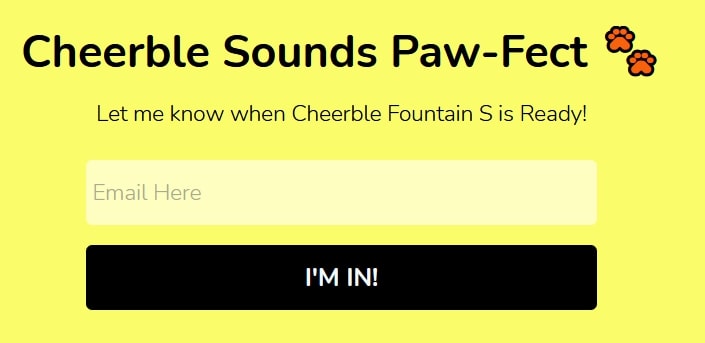
Subscription/Reservation
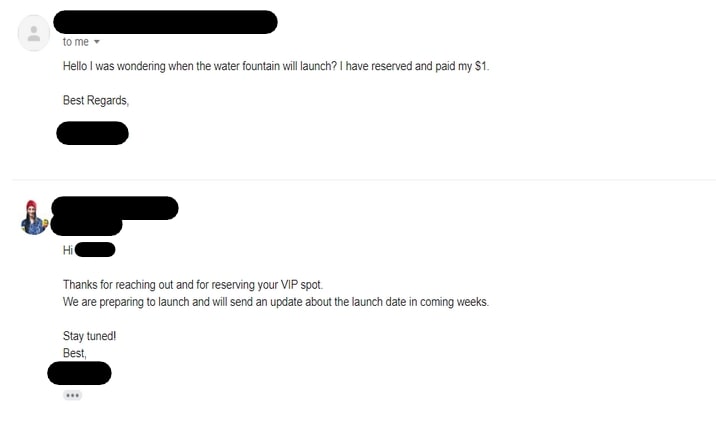
As with all our pages, the landing page of Cheerble Fountain S included a subscription form and reservation funnel, just the way we described above.
During the testing, we gave our reservers a VIP status and told them they would be the first to learn about the launch. We conducted the communication with them exactly within that logic.
Advertising
Ads are one of the key elements during our testings. They help you understand which countries, age groups, gender, etc., work best for your product and thus adjust your ads, SMM posts, page copy, visuals, and traffic sources to them.
Here are some of the key results we got from our ads:
Based on this information, we were able to create the most working content for the Cheerble Fountain S.
Aside from this, we also tested Pixel for gathering valuable information about your page visitors and sending them relevant ads. That’s what we did for Cheerble Fountain S! In the value section, we mentioned the price of our product and the reservation, which helped us find people on Facebook who tend to make reservations within the price range of our product.
Another important aspect of paying attention to is the comments under ads. These are other sources to help you measure your customers’ interests. For Cheerble Fountain S, the comments were mostly positive.


At the same time, we did our best to keep the cost per lead, cost per reservation, and CPM low, but increase the CTR.
One thing to remember about these metrics is that throughout the product validation testing, all of them require intensive tracking—much more intensive than during live campaigns—as that helps make relevant adjustments, as well as find out the estimated costs for the campaign and predict how much the product would be able to raise. This is especially vital given the challenges innovative products face during these uncertain health crisis times.
Design
Another thing we paid close attention to during the Cheerble Fountain S testing was the design. In this case, our testing showed that colorful images and gifs worked pretty well with our audience.


All this created an atmosphere of fun and corresponded to the mood of the product.
Benchmarks
And lastly, we looked at the benchmarks—the average data gained from the products in our category.
According to our research, the benchmarks for pet products like Cheerble Fountain S were as follows:
- Subscription rate: 20%
- Price Validation: 4%
- Sub to reserve: 15%
After several testings, the data showed that the product was very close to achieving its product-market fit. Here are the results:
- Subscription rate: 29.32%
- Price Validation: 3.10%
- Sub to reserve: 11%
Having these data in mind, we had a strong ground to launch a live campaign. Currently, the fountain – which we rebranded into a smart self-cleaning dispenser called Drinkie – is live on Kickstarter, having raised over $200K with the help of 1800+ backers.
This once again proves the importance of conducting a product-market validation and justifies the time and effort you spend on this process.
Conclusion
Each of us can come up with a genius idea that could help people like us in their daily life or even save humanity. But the point between simple ideation and success is the product and market validation. You can’t start a business just because you think you have an interesting idea: This path is full of risks and losses.
A wiser and more reliable strategy is to conduct a product-market fit to understand whether the market and your customers specifically need your product. This product and market validation process allow you to realistically assess the potential of your product, make adjustments to it, and, most importantly, understand whether it’s reasonable to make big investments in it.
Thus, next time a million-dollar idea crosses your mind, don’t just jump into bringing it to life. Instead, put efforts into finding your product-market fit so you can make data-driven decisions on your next steps.