After I started my marketing agency and had my first few successes, everyone started to ask me what I thought of their ideas. Jumping at the opportunity to show off my newfound wisdom, I’d put on my teacher’s hat and make some very bold bets.
“It’s a great idea; go for it!” I’d tell some people, or “Do something else. This one sucks!”
Then, I’d see how my advice and predictions played out. After all, I was launching dozens of products for my clients and partners. I should have been pretty accurate at predicting launch success, right?
Surprisingly, many of my bold bets failed, and others that I predicted would fail ended up succeeding.
I put this down to my experience or lack of it. I told myself that with time, my predictions would become more accurate. But after working on thousands of product launches over the past seven years, I’m not much better at predicting launch success than I was back then. And I realized that all those experts and gurus, all those investors and angels that pretend to know what will succeed, are about as clueless as I was.
Why?
Simply because the market is unpredictable. It doesn’t take into account how many times you were right before. This time you may be wrong.
Now, when I’m asked what I think of a product, my answer is simply, “I don’t know… only the data knows!”
But it’s not just any data. You need to know what to look at because only reliable and meaningful product launch metrics can tell you if you’re on the right track. It took us three years to understand the “right” launch metrics you need to look at to accurately predict your product launch’s success. And, more importantly, how to measure product launch success.
I wrote a now-famous LinkedIn Post on this — about how dangerous it is to rely on the wrong product launch KPIs, also known as Vanity Metrics. And how they can make you excited initially, only to sink you later on. After seeing so many people comment and follow up on this post, I decided it was worth breaking this down some more, and it grew into this article that you’re reading now.
While most entrepreneurs will be lucky to launch ten products, we launch more than that every week. That’s a lot of data to analyze! And we track all of these product launch metrics on Prelaunch.com. Nearly 40 different data points per visitor, and that number’s constantly growing. And while the entire team has grown into part-time data scientists, we didn’t want to burden our partners and users with a SpaceX-like dashboard — we wanted something that everyone could understand and use immediately!
So, while there are a lot of things you can track, these are the 10 proven most important product launch metrics for any prelaunch campaign (even if you don’t launch it on Prelaunch.com!)
The 10 Product Launch Metrics
Subscription Rate
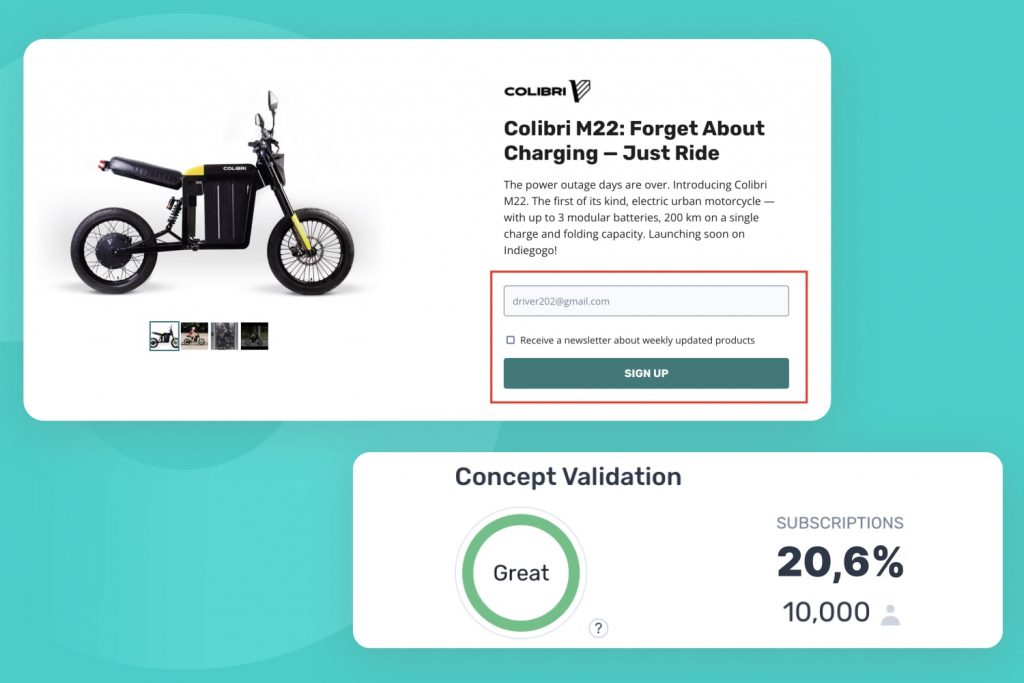
This is the most basic launch metric that almost any landing page builder can measure. It shows you the percentage of landing page visitors who sign up to learn more about your product.
Why It’s Important
This metric measures general interest in your product and lets you know if you’re targeting the right audience.
Low subscription rates might not necessarily mean you have a bad product. It might also mean you’re targeting the wrong people. So before dropping the idea completely, try changing your target audience, copy, and visuals first.
What You Should Aim For
20% — it can be higher for mass-market products and lower for niche products.
Reservation Rate
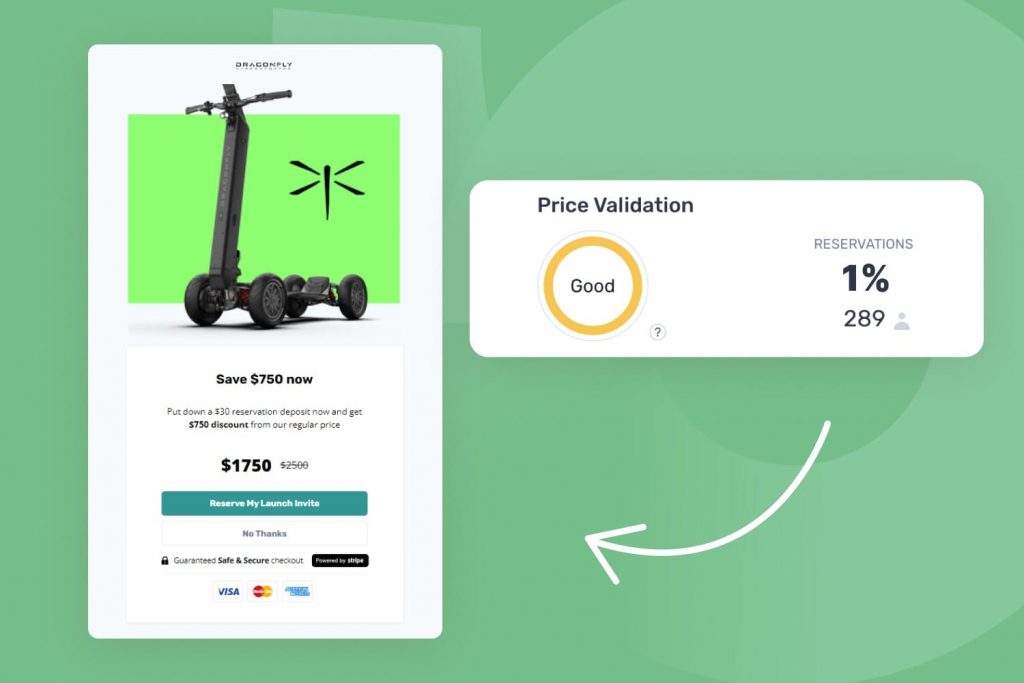
If you’ve set up a full prelaunch flow as we recommend here, this metric will show you the percentage of visitors who end up leaving a small 5-10% reservation deposit for your product.
Why It’s Important
This is one of the most important launch metrics. It confirms how likely your audience is to buy your product when it launches.
What You Should Aim For
2% — for products that are under $500.
1% — for more expensive products.
At Prelaunch.com, we use much more flexible benchmarks based on product category, audience, and price, but this is roughly what you should aim for.
Subscription-to-Reservation Ratio
By combining the above two rates into the ratio of subscribers to reservations, you can more accurately see the difference between price-independent ‘interest’ and actual purchase intent.
Why It’s Important
This product launch metric reinforces the previous one and shows how much of the interest can actually be turned into sales — or how likely your subscribers are ready to buy.
When there are lots of people subscribing, but very few end up reserving, it speaks to the quality of your traffic.
What You Should Aim For
15% — if you’re targeting the right audience.
Prelaunch Score
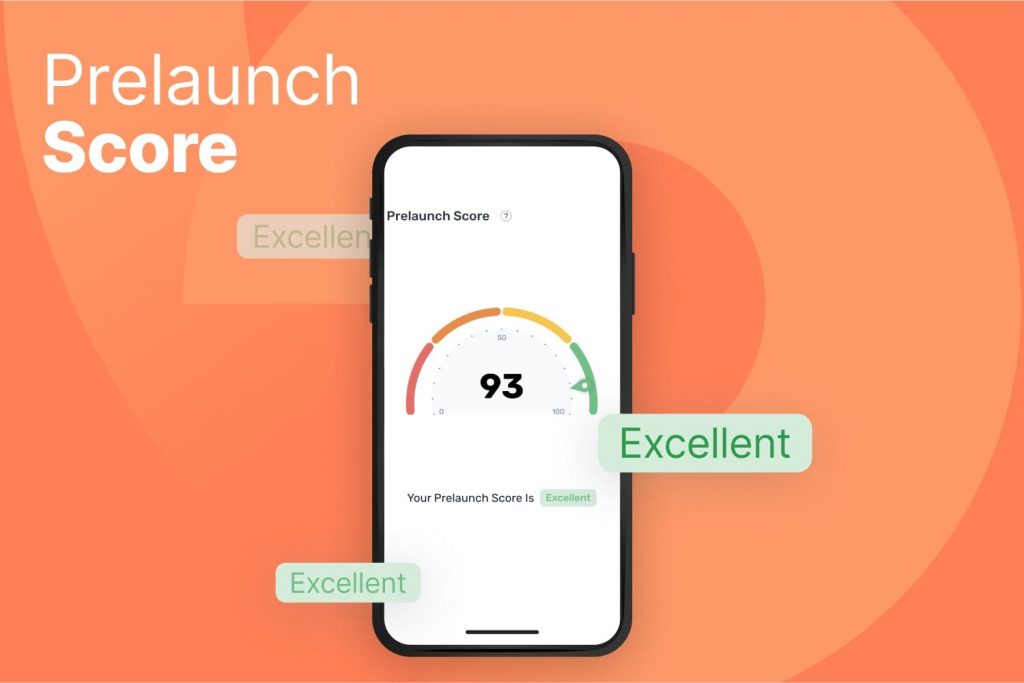
While the Prelaunch Score is only available at Prelaunch.com, it’s important to understand what it measures and why it’s important.
Why It’s Important
The Prelaunch Score is a complex index composed of 30+ launch metrics developed and constantly improved by our data scientists.
It takes into account similar patterns and audience behavior across hundreds of projects in your niche. And then, it distills all this complex information and presents a very clear result in your product launch metrics report, along with some simple guidance on how to improve things.
What You Should Aim For
Generally, Excellent means your project is performing well, while Bad means your performance is below average.
Cost per Reservation
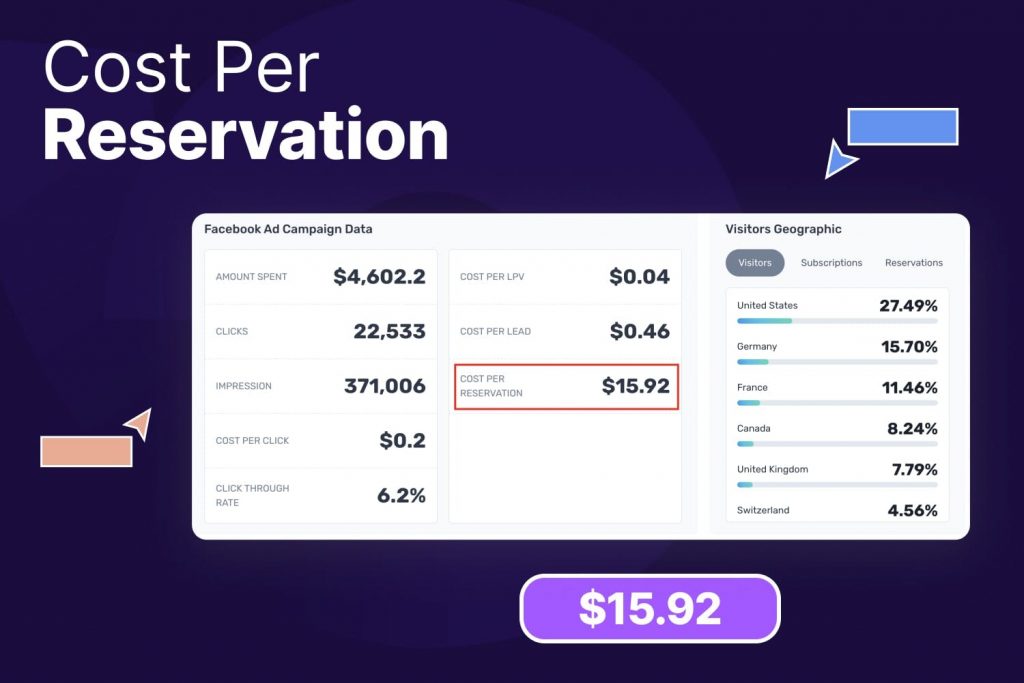
This shows how much each reservation costs you, based on the amount you spend on Facebook or Google ads.
Why It’s Important
It can inform your prelaunch stage and whether you can scale or not. But more than that, it gives you an understanding of what your potential return on ad spend will look like when you launch.
You might see a great subscription rate, a great reservation rate, and even a great subscription-to-reservation ratio. But if each reservation costs you more than the price of your product, you will end up spending more than receiving.
What You Should Aim For
10% of your product price or less — if the price of your product is $100, aim to spend less than $10 on each reservation.
Click Through Rate
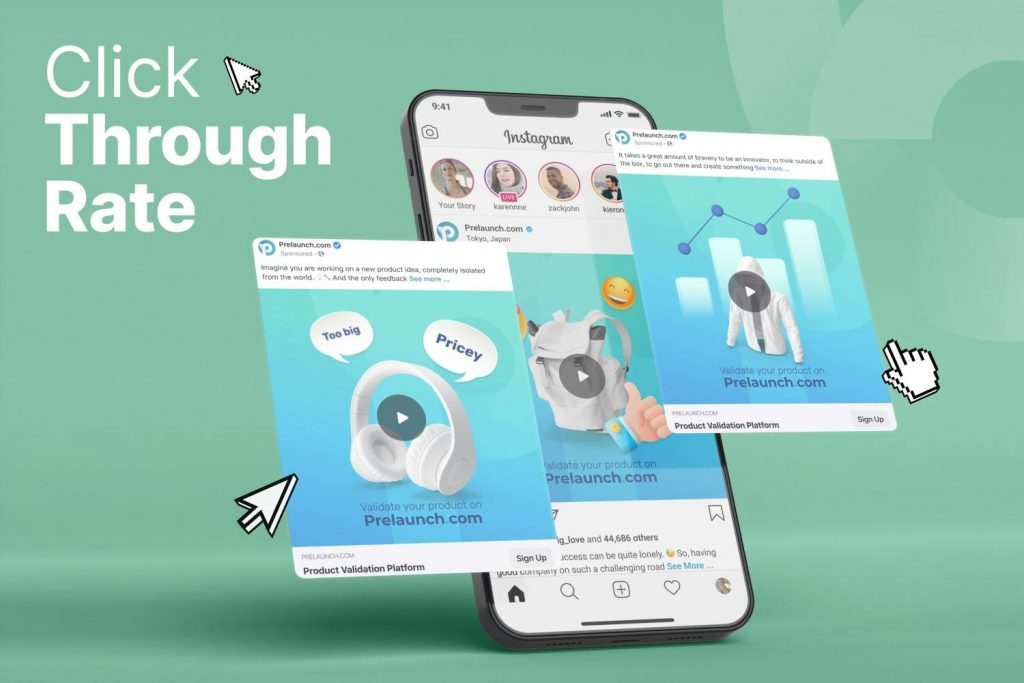
Click Through Rate or CTR shows how many people clicked on your Google or Facebook ads after seeing them.
Why It’s Important
Generally, it’s another product launch metric to measure market interest and whether you’re targeting the right audience or not.
It can also show how big your market is. High CTR means your product is receiving a lot of interest and has the potential for broader market appeal.
What You Should Aim For
1-10% — This is a big range, but as Click Through Rates varies so much between products, price ranges, and audiences, it would be misleading to offer exact numbers.
Cost per Landing Page View
This metric shows the cost of bringing each visitor to your page from Facebook or Google. Whether or not they reserved or subscribed.
Why It’s Important
This is another metric that shows how scalable your product’s potential is. It also shows whether your ads are performing well or not.
If your reservation and subscription rates are high but your cost per landing page view is low, your ads are probably underperforming.
What You Should Aim For
Generally, the higher the cost per landing page visitor, the harder it will be to scale your successful product launch.
And vice versa. If you are able to drive cheap, relevant traffic to your page, your chances of scaling are significantly higher.
Cost per Lead
This is how much it costs you to get one subscriber.
Why It’s Important
While it’s strongly correlated to other metrics, it separately helps you understand how many subscribers you will gather based on your final budget.
What You Should Aim For
$2-3 — true for most mass-market products.
Cost per Click
Essentially shows how favorable the gods of Facebook and Google are toward your project.
Why It’s Important
Cost per click gives you a few insights.
- Consistency in messaging between ads and landing page — if both this and your subscribe rate are low, people might be clicking a lot on interesting ads but are dissuaded by the product presentation on your landing page. If the opposite is true, you need to focus on creating better ads.
- Audience nicheness — if your cost per click is high, your target audience might be too niche. Consider opening it up.
But don’t get too obsessed with decreasing this launch metric too much because focusing on decreasing your cost per click might just land you with irrelevant traffic.
Reservation Elasticity Rate
Test different reservation prices (eg. $1 – $30) and use this metric to test how price sensitive your audience is.
Why It’s Important
If you have a $4,000 e-bike, a $1 reservation doesn’t really prove whether people are ready to make that level of investment. Try increasing it to up to 10% of the price amount and measure the varying reservation rate.
What You Should Aim For
If you see less than a 20% change in the reservation rate, it means you have very static demand. This is a great way to measure product success. As it’s a good sign of real purchase intent and not dependent on the reservation amount.
Applying These Product Launch Metrics to Your Own Prelaunches
It may seem like there are too many launch metrics for you to keep track of. But learning how to use these changed how we approached product validation, selected new partners, and started our marketing activities. This is why they are fundamental to helping you understand what you need to focus your attention on and where exactly you need improvements.
The wrong metrics can really mislead you. They give you false confidence, and this can have disastrous consequences!
Imagine your product has 200 million users. Sounds good, right? Well, that’s how many users Google Plus had when it was shut down! Those 200 million users were the false vanity metrics that wasted valuable company resources for nearly a decade! But at the end of the day, Google Plus just never built enough retention and engagement — which would have been the right product launch success metrics to consider in their case.
It can be really hard to keep track of all your metrics. Different goals require different metrics. But one thing you now know for sure is that you always need to be careful with vanity metrics. If you’re not, you’ll get excited about the wrong metrics and end up wasting valuable resources.
At Prelaunch.com, we analyze all of the above-mentioned metrics and more to provide a clear picture and help creators like you understand what’s working and what isn’t. To help you focus not on the vanity metrics but on the Right Product Launch Metrics.
Start using them yourself today on your own site. Or check out Prelaunch.com today and validate your product in a few simple steps for free before you invest all that time and money in a product that nobody wants.


